How to Build a Trend Radar: A Step-by-Step Guide for Strategy Teams
- A trend radar helps clarify the external factors that influence strategic decisions. While strategies are usually based on internal strengths and competition, outside forces such as technological changes, regulations, social and environmental shifts, and economic pressures are often overlooked. A trend radar visually organizes and prioritizes these factors, making them easier to consider in planning.
- Companies that excel in this approach integrate it into their core infrastructure. For instance, PepsiCo's Global Insights team has implemented trend radars to continuously monitor markets and categories, ensuring that trend intelligence directly informs strategic decisions. Similarly, Ageas, an international insurance company, has established a process to identify trends across selected megatrends and connect these insights to the company’s strategic planning.
- For strategy teams, the key value lies in integrating the radar into the planning cycle. A trend radar can be beneficial across several functions, such as Foresight, Strategy, Innovation, R&D, Insights, or Risk. When connected to strategy, it focuses on monitoring whether the external conditions that justify the current strategy still apply and highlights when they do not.
- A continuous radar enables adaptive monitoring, which makes the strategy adaptive. A radar built once gives a snapshot. A continuously operating radar works as a signpost system, tracking trends and providing insights into whether the environment is moving toward or away from the future your strategy was built for
Many strategy teams rely on various forms of external environment monitoring, such as quarterly trends presentations or annual discussions. However, one challenge lies in the fragmented nature of the information, which often fails to connect to decision-making and is presented in a way that lacks urgency and clarity. Consequently, teams may only recognize shifts in the external environment that render their strategies obsolete during the next planning cycle, rather than in real-time. A consistently updated trend radar can bridge this gap, enhancing the strategic planning process.
What Is a Trend Radar?
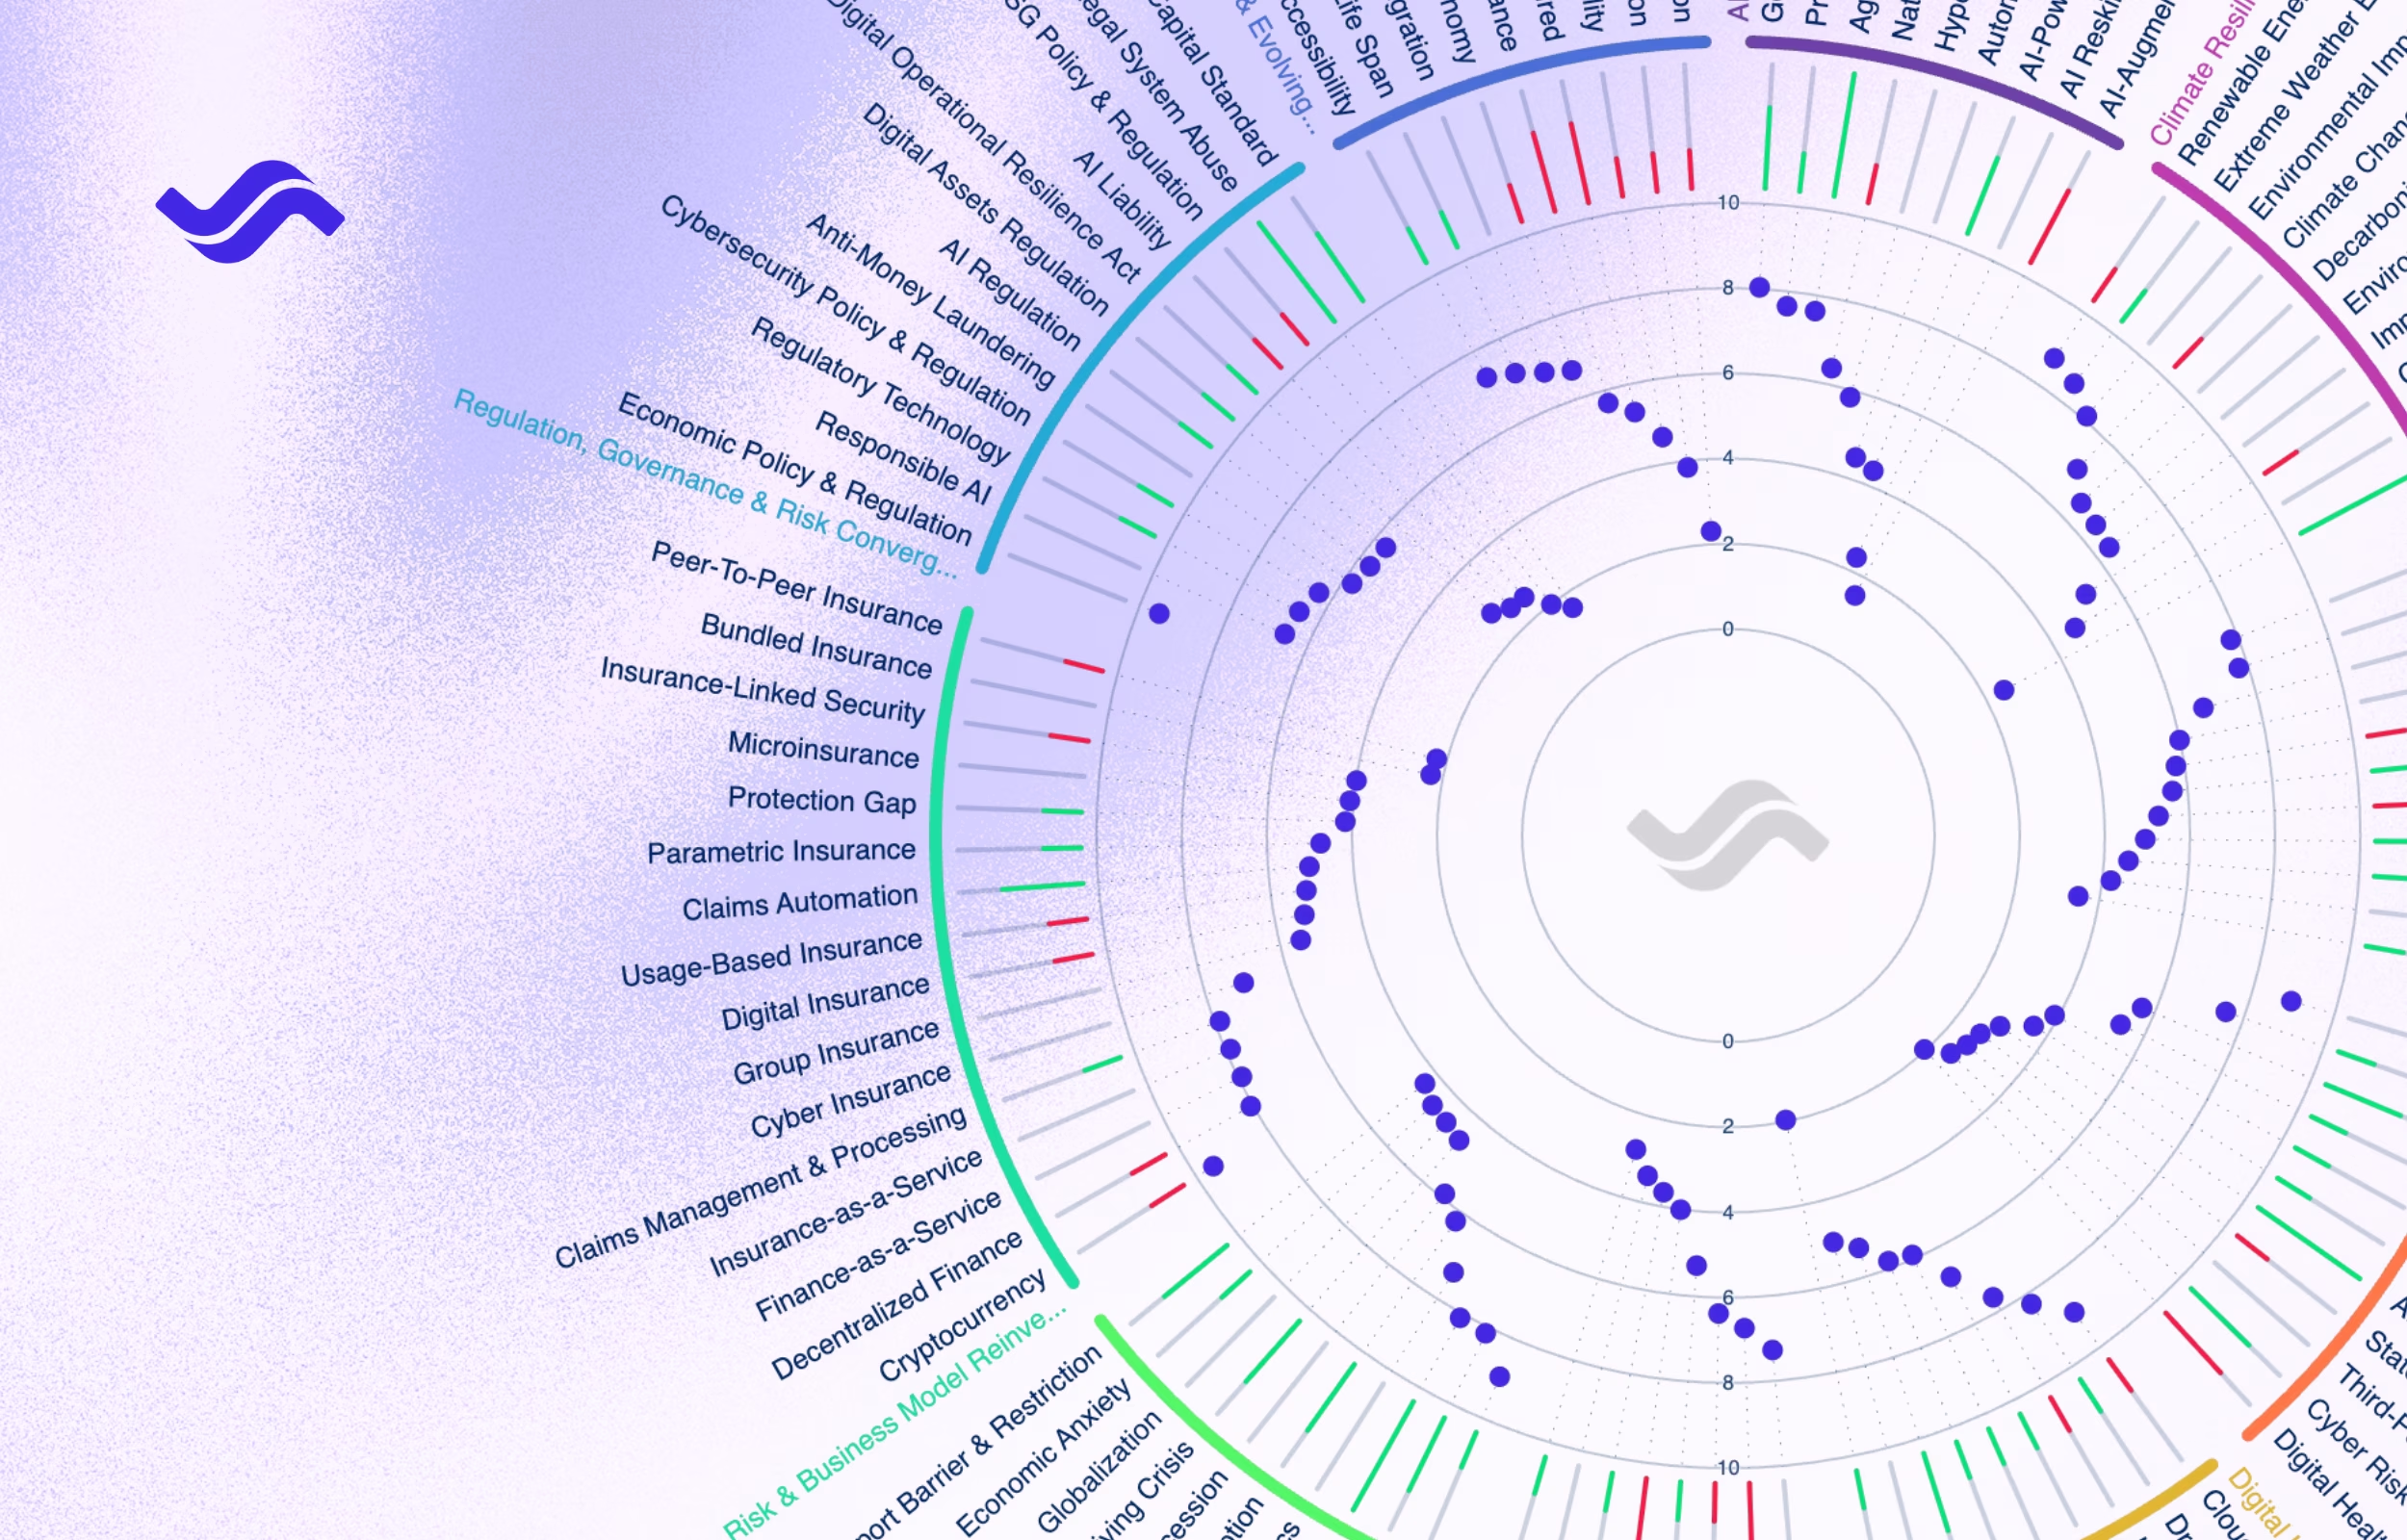
A trend radar is a visual foresight tool that maps trends across domains such as technology, society, economy, environment, and politics in a structured layout for a specific business or industry context, allowing teams to easily organize and prioritize trends.
The format features a circular chart divided into sectors and rings that typically represent time horizons, with each trend positioned based on criteria such as maturity, time horizon, or current strength. This visual structure enables simultaneous comparison of multiple trends and helps identify patterns across domains that a list may not reveal.
Implementations of trend radars vary significantly. Many utilize fixed concentric rings to denote time horizons, such as 0–2 years, 2–5 years, and 5+ years, or to categorize levels of action readiness, including act, prepare, and monitor. Alternatively, some radars adopt a more data-driven approach, positioning trends based on continuous scores, such as trend strength (how visible or prominent a trend currently is) or rate of change (how quickly that visibility is rising or falling), with their distance from the center reflecting the score rather than a fixed category.
Trend radars also differ in their maintenance. Some exist as a one-time snapshot in a report or presentation, updated during the next planning cycle. Others are continuously updated views that are refreshed as new data arrives, rather than being redrawn annually.
The prioritization of trends follows a similar pattern. A radar can be assessed by a group of experts in a single workshop, creating a snapshot, or continuously fed by data from numerous sources, including research papers, patents, regulatory filings, news, and industry reports, capturing how trends evolve over time.
For example, PepsiCo's Global Insights team operates an always-on trend radar, part of its broader monitoring process (the Change Compass), tracking established market trends and emerging signals. This output informs strategy, innovation, and product decisions. Similarly, Ageas, an international insurance group, uses its internal think tank, Think 2030, to monitor hundreds of trends relevant to the insurance industry. They combine AI-driven detection with insights from over 1,500 surveyed employees annually, using the results to guide their long-term strategic planning. In both cases, the radar serves as a live, continuously checked tool that informs decisions in real time, rather than after the fact. Check out Ageas and PepsiCo's Customer stories.
Why Strategy Teams Need a Trend Radar?
Strategy formulation relies on three key input layers. The first is internal: organizational capabilities, resources, culture, and financial standing. The second is industry-level: competitors, market share, growth rates, and customer segments. The third is the broader external environment: macro trends, regulatory developments, technological shifts, social changes, and environmental constraints that sit outside any single industry but can reshape it.
Most strategy processes handle the first two layers well, backed by regular data and established frameworks. The third is typically the least structured input, and the reasons why matter enough to shape how a strategy team should treat it.

Here's why that third layer is worth structuring, and why a radar built to run continuously handles it better than a periodic scan.
First, every strategy relies on assumptions about external conditions such as regulatory stability, technology trajectories, consumer behavior, and geopolitical configurations. While these assumptions are valid at the time of formulation, they evolve as the environment changes. If no one systematically tracks their accuracy, the strategy may diverge from reality. The practice of identifying which external developments would confirm or challenge those assumptions, then monitoring them continuously, is what keeps a strategy testable against reality. A trend radar provides a visual structure for this monitoring process.
Second, the volume of potentially relevant external signals has increased, surpassing what periodic scanning can manage. Technology cycles have compressed, regulatory environments are shifting across multiple jurisdictions, and social and demographic patterns evolve faster than annual planning cycles can accommodate. A structured visual display that indicates which trends are accelerating, plateauing, or converging provides strategy teams with a relevant decision-making filter.
For a comprehensive look at how trend insights connect to the entire strategy cycle, see Foresight-based Strategy: How to Anticipate Change and Act Before Disruption.
How to Build a Trend Radar: Step by Step
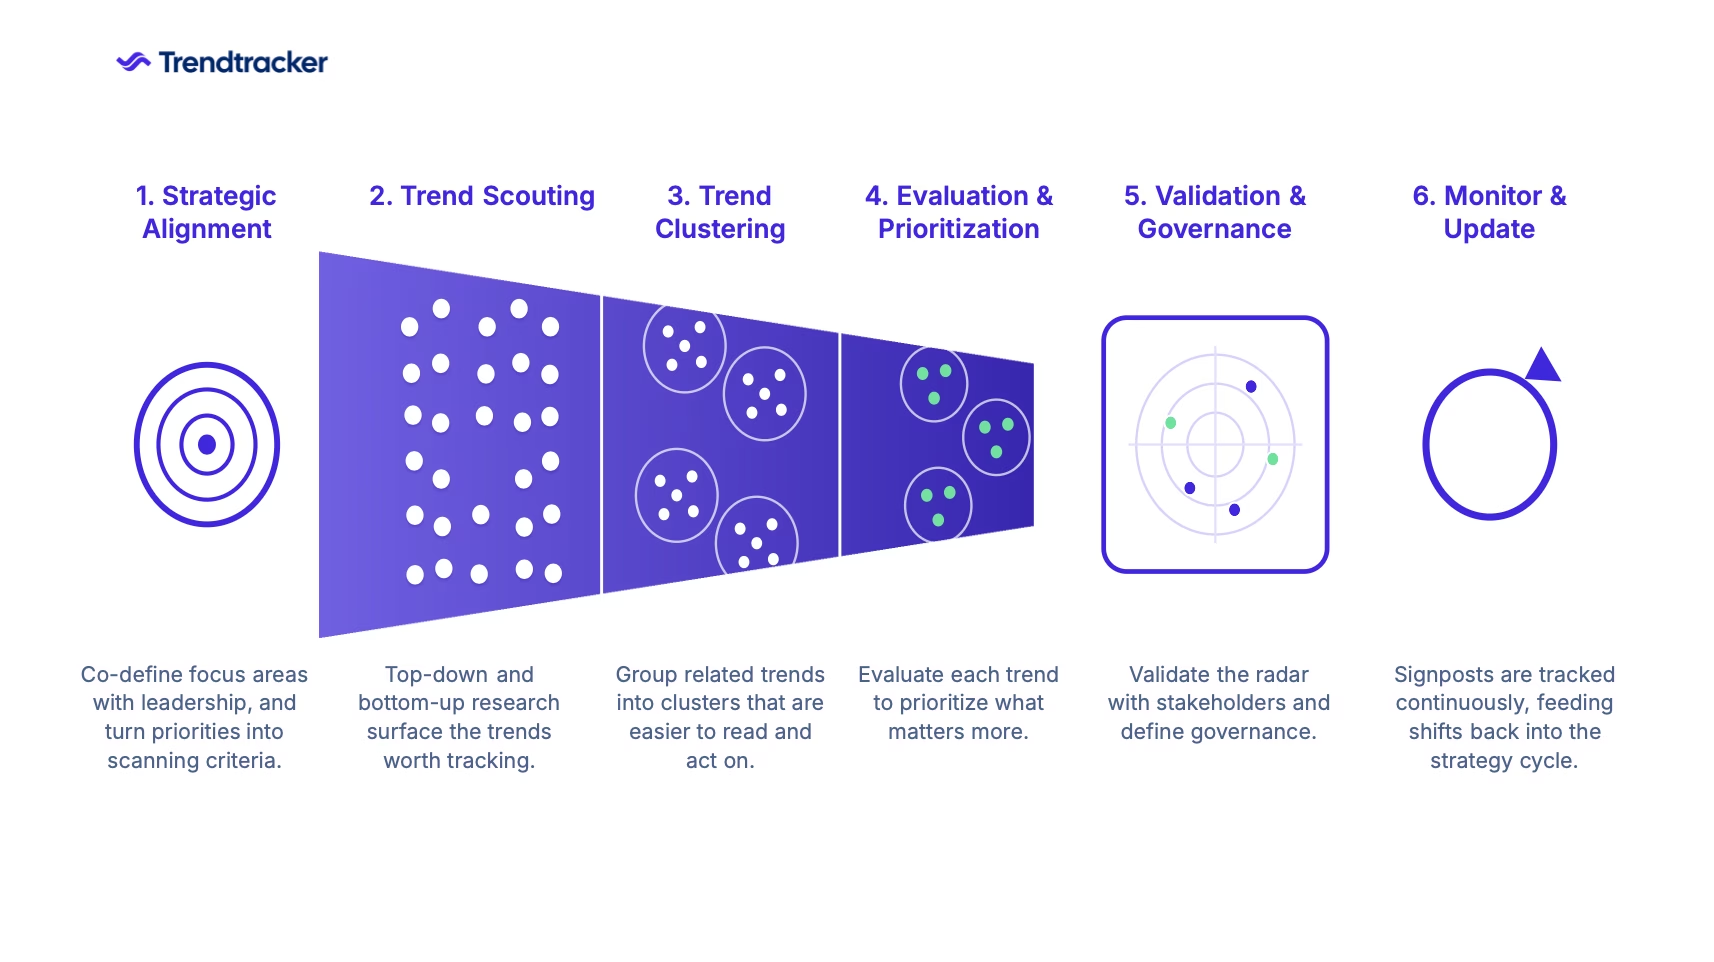
Our approach at Trendtracker breaks this down into six steps, from defining strategic scope to a continuously monitored radar. Here's the full sequence, followed by what each step actually involves.
Step 1: Strategic Alignment
Every trend radar should begin by defining the questions it needs to answer. This stage brings the organization's leadership directly into the process, working together to identify the focus areas that matter across business lines, risk domains, and geographies. The goal is to translate strategic priorities into scanning criteria that the rest of the process can act on.
In Trendtracker, this stage is built by our strategist experts around what we call Customer Context: an organizational profile that we co-create with our clients, covering the organization's industry, competitors, key stakeholders, external macro forces, and strategic objectives and success criteria. Once that context is defined, it becomes a permanent filter on everything the platform surfaces, so alignment holds across the process.
Step 2: Trend Scouting
With scanning criteria in place, scouting draws on inputs from both directions. Top-down sources, industry reports, desk research on recent market developments, and interviews with internal and external experts capture what's already understood about the industry's direction. Bottom-up sources capture what's just starting to surface: weak signals that haven't yet consolidated into a recognized trend.
Trendtracker adds an input that most manual scouting can't match at scale: a continuously updated database of several thousand tracked trends, drawn from tens of thousands of sources. Instead of building a trend list from scratch, teams start from a base that's already scanning the relevant industries, and surface the ones specific to their own context.
Step 3: Trend Clustering
A raw list of individual trends is hard to work with once it grows past a hundred or so entries. No team can hold that many discrete data points in mind at once, let alone prioritize them. Clustering solves this by grouping related trends under a shared theme. Aging population, for instance, isn't one trend but an umbrella covering a dozen or more specific developments, in healthcare demand, retirement models, and workforce structure, that make more sense read together than scattered across an unstructured list.
Trendtracker clusters trends automatically, and clusters can be grouped again into broader landscapes for organizations tracking a wide enough scope to need two levels of structure. Each cluster carries its own aggregate metrics, so a strategy team can read the state of an entire theme without opening every individual trend inside it.
Step 4: Evaluation & Prioritization
A raw list of 200 trends clustered into 15 themes still leaves the real question open: what actually matters? The common human-driven answer is a relevance, impact, and uncertainty assessment, run as a workshop or an asynchronous survey, where selected people across the organization score each trend against a few consistent questions: how relevant is this to us, how uncertain is its evolution, how much impact could it have on our business. That framing brings different parts of the organization into the same conversation, but it strains once the list runs into the hundreds. Nobody is an expert on every topic on it, and a fair amount of the scoring quietly turns into a guess dressed up as a number. Data-driven scoring complements that process, closing the gap without replacing the judgment behind the survey.
Trendtracker offers various metrics for each trend and cluster of trends. One key metric is the Trend Strength Index, which ranges from 0 to 10. This score indicates the visibility of a trend within a specific industry, calculated as a rolling 12-month average of how frequently it's mentioned across our +20.000 monitored sources. It's normalized to allow for easy comparison between trends of different maturity and data volume. Another important metric is the “% of Change,” which tracks the shift in mentions of the trend over the past year. This reveals whether attention to the trend is increasing or decreasing. When considered together, the Strength Index shows how prominent a trend is right now, while the % of Change indicates the direction and speed at which it's moving.
Step 5: Validation & Governance
A scored radar still needs to go back to the people who'll use it, and to the leaders sponsoring the initiative, before it's finished. Validation checks that the radar actually covers the trends that matter for the strategy team's real priorities and assumptions. It also builds ownership: when people see their input reflected in the final version, they tend to stay engaged with the project rather than treat it as something handed down to them.
Governance is what happens after validation. Someone has to be responsible for connecting what the radar shows to the decisions it's meant to inform, or the radar becomes a report that gets read once and shelved.
Trendtracker supports this stage with the ROESI action model (Recognize, Observe, Explore, Strategize, Incorporate), which assigns every trend a recommended action stage based on its impact and maturity. That gives governance a shared vocabulary: instead of a flat list of scores, the team gets a clear read on which trends still need watching and which are ready for a strategic response.
Step 6: Monitor, update, and connect back to strategy
The monitoring discipline connects the radar back to Step 1. The strategic question defined the radar's scope; signpost tracking now tests whether the external conditions that justified the current strategy still hold. When a signpost crosses a threshold (e.g., a regulatory development moves faster than expected, a technology reaches commercial viability ahead of schedule, a social trend reverses), the radar should be where that becomes visible first. And when it does, the radar feeds back into the strategy review cycle: here's what changed, here's what it means for our assumptions, here's what we should reconsider.
Trendtracker maintains an active loop between planning cycles by continuously updating metrics as new data is added to the system. This allows shifts to be recognized in real-time rather than waiting for the next scheduled review. Additionally, the Strategy Brief feature synthesizes numerous trends, highlighting key convergences in a format designed for strategic discussions. This enables teams to explore potential implications for their organization and assess risks and opportunities effectively.
Conclusion
A trend radar earns its place on a strategy team's desk when it stops being a periodic deliverable and starts functioning as a continuous instrument: one that connects the external environment to the assumptions behind the strategy, and surfaces when those assumptions need revisiting.
The six steps above work regardless of how the radar gets built, on sticky notes in a workshop or inside dedicated software. Where the discipline usually breaks is in Step 6. Keeping the monitoring loop running continuously, at the speed the external environment now moves, across the volume of signals it now generates, is hard to sustain by hand. That's the specific problem a strategic intelligence platform is built to solve: making sure a signpost crossing its threshold gets noticed the week it happens, not the quarter after.
References
Blechschmidt, J. (2022). "Trend Radar: Overview of Relevant Trends." In Trend Management, Business Guides on the Go. Springer.
Van der Heijden, K. (2005). Scenarios: The Art of Strategic Conversation (2nd ed.). Wiley.
Rohrbeck, R. & Kum, M. E. (2018). "Corporate Foresight and Its Impact on Firm Performance: A Longitudinal Analysis." Technological Forecasting and Social Change, 129, 105–116.
Schwartz, P. (1991). The Art of the Long View: Planning for the Future in an Uncertain World. Doubleday.